Render QC · measured, not marketed
How good are our renders, really?
Every figure on these pages is measured on a real benchmark run and shown with its methodology — sample size, 95% confidence interval, library, pipeline version, and the date it was measured. No figure can appear without them. We publish the weak numbers next to the strong ones; an unmeasured cell says so instead of pretending.
Pick a vertical
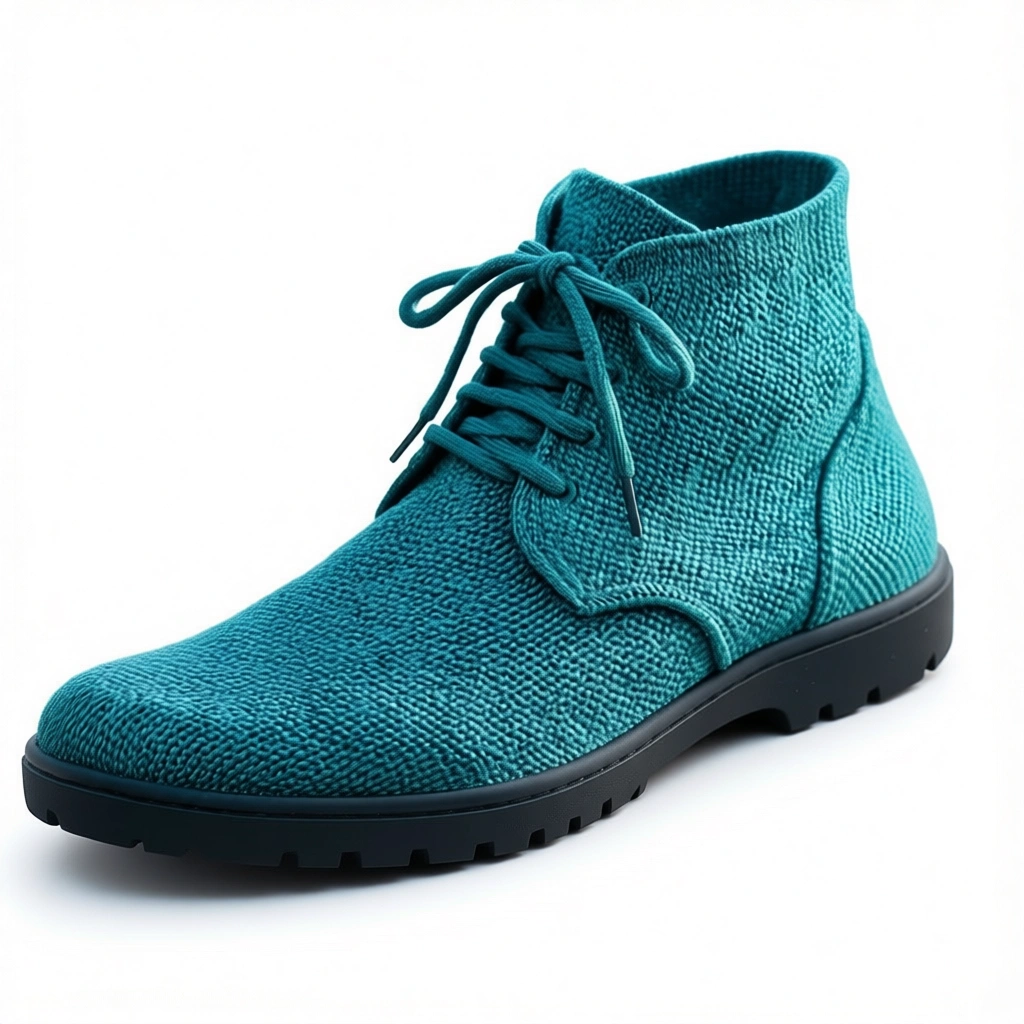
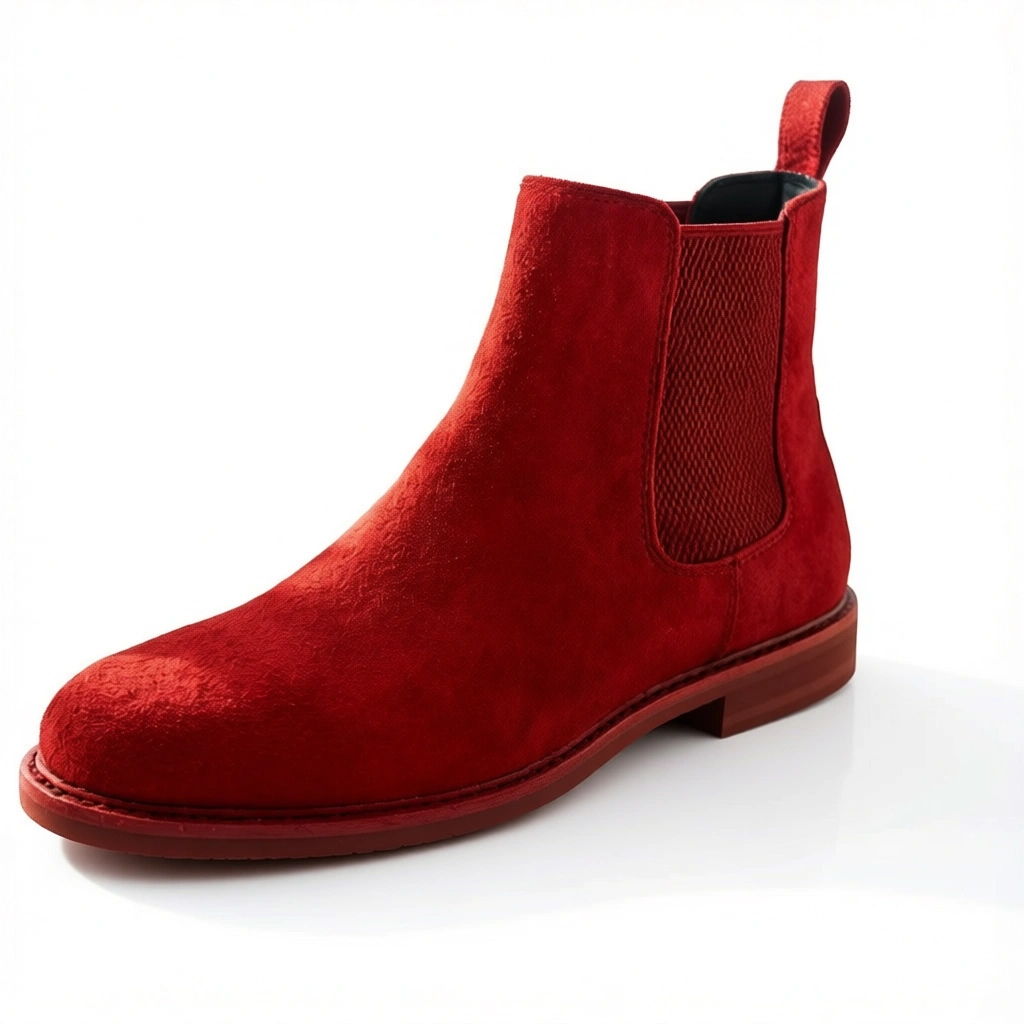
Fashion
Try-on identity and stance preservation, recolor colour fidelity — the two hardest shoe presets, reported honestly.
8 measured figuresView scorecards →
Product
Marketplace white-background compliance, frame occupancy, and product-redraw detection for PDP imagery.
6 measured figuresView scorecards →
Food & Beverage
Render sharpness and perceived quality for menu and delivery-app imagery. Benchmark set not yet measured.
PLACEHOLDER · run harnessView scorecards →
Interior
Render quality for room staging and furnishing. Benchmark set not yet measured.
PLACEHOLDER · run harnessView scorecards →
The pipeline that produced these numbers
-
1
Synthetic input image
Generated with oaktree/image for the benchmark — not a customer photo.
-
2
oaktree/image-edit
Single Oaktree edit pass. No -pro variant.
-
3
Output render
The generated image being judged.
-
4
QC measurement
colour-science + MediaPipe + BiRefNet + piq/torchmetrics.
Model
oaktree/image-edit
Cost / image
$0.04
Inputs → outputs
196 → 196
Total run cost
$7.84
measured 2026-06-13 · pipeline v3.0 · 1 day ago
Honest caveat: benchmark inputs are themselves AI-generated (synthetic), so these numbers measure the edit pipeline against generated inputs, not customer photography. We disclose this rather than hide it; a curated real-photo set is tracked as future work. Numbers are re-measured manually on every model or pipeline change — the "measured … ago" stamp above is the freshness signal.
The metrics
Each figure is computed by a named open library against a stated threshold. Metrics whose pass bar is still being calibrated say so — they show their value and methodology, but no pass/fail badge until the bar is defensible.
Color fidelity (ΔE 2000)
≤ 2.0 ΔE (imperceptible)Mean CIEDE2000 colour difference between the input shoe's material and the rendered output, across the test set. Below ~2.0 a difference is imperceptible to the human eye.
Background compliance
≥ 95% PDP passShare of renders whose background pixels sit within the marketplace pure-white spec (RGB 255 within tolerance) — i.e. the Amazon / Shopify PDP white-background pass rate.
Face preservation
≥ 0.99 landmark cosineCosine similarity of the MediaPipe face-mesh landmark geometry (478 points, translation- and scale-normalised) between input and output, for on-model shoe shots. Confirms the shoe swap did not alter the model's face. NB: this is landmark geometry, not a face-recognition embedding — it verifies the face is unchanged, it is not a forensic identity match.
Pose / stance preservation
≤ 0.15 stance drift (torso-norm)Mean drift of the 33 MediaPipe pose landmarks between input and output, torso-normalised (centered on the hips, scaled by the shoulder→hip span) so it measures actual stance change, not the edit re-framing the shot. Footwear must hold the leg/foot stance — lower is better.
Frame occupancy
≥ 85% of frame (Amazon spec)The product's longest dimension as a share of the frame side (BiRefNet foreground mask bounding box). Marketplaces want the product to fill the shot — Amazon's main-image spec asks for ≥ 85%.
Silhouette preservation
≥ 0.90 shape IoUShape agreement of the product's foreground silhouette, input vs output, after normalising for position and scale — so a benign re-frame doesn't count as damage, but a warped or partially redrawn product does. 1.0 = identical shape.
Perceptual drift (LPIPS)
calibratingDeep perceptual distance between the input and output product regions (mask-aligned crops), catching subtle texture/detail redraw that colour metrics miss. 0 = perceptually identical; lower is better. Compared on aligned crops so re-framing alone doesn't score as drift.
Structure+texture drift (DISTS)
calibratingDISTS perceptual distance (structure + texture) between the mask-aligned input and output product regions. Companion to LPIPS; lower is better.
Render sharpness (BRISQUE)
calibratingNo-reference image-quality score of the output render alone (natural-scene statistics): blur, blockiness and synthetic artifacts raise it. Lower is better. Calibration caveat: large flat studio backgrounds inflate BRISQUE by design (they break natural-scene statistics), so read it as a relative regression signal across runs, not an absolute photo-quality grade.
Perceived quality (CLIP-IQA)
calibratingZero-shot CLIP contrast between “Good photo.” and “Bad photo.” on the output render — a learned proxy for perceived photographic quality. 0–1, higher is better.
Auto-QC first-pass rate
≥ 85% first passShare of renders clearing the automated QC gate on the first pass (no retry). Measures how often the pipeline gets it right the first time.
Per-render certificates
Every benchmark render carries its own QC certificate with a shareable link — its actual measured numbers, not an average.
White-Background Standardizer
View QC certificate →
White-Background Standardizer
View QC certificate →
White-Background Standardizer
View QC certificate →
White-Background Standardizer
View QC certificate →
White-Background Standardizer
View QC certificate →
White-Background Standardizer
View QC certificate →
Subjective notes
not a metricThese are human impressions from reviewing the set — deliberately kept out of the numbers above. "Looks good" is not a measurement. Recolors read clean on matte materials and get harder on glossy patent finishes; on-model try-ons are most convincing in neutral standing poses. Treat this as context, not as a score.